01
Issues caught early
Spot alerts and slowdowns before they stop production.
 ×
SyncOSTM Dashboards brings data from every fleet, task, process and connected system into one live view. Track the KPIs that matter to each team, catch issues before they stop production, and let AI point you to the next improvement.
Book a demoFour shifts, felt by everyone from the operator on the floor to the plant manager.
Spot alerts and slowdowns before they stop production.
Operators, supervisors and managers each see the KPIs they own.
Data from every vendor's machines in one place, not dozens of silos.
AI turns trends into clear next steps, shift after shift.
Physical AI is intelligence grounded in the real world: robots, machines and material moving on your floor. Because SyncOSTM connects and runs every system, its AI learns from what actually happens on the floor, and what it finds goes straight back into how the floor runs.
Every robot, machine and system reports into SyncOS™, whatever the brand, so you get one live picture of the physical operation.
AI finds bottlenecks, trends and risks in that data, and answers your team's questions in plain language through AI Assist.
Insights turn into changes in your Integrator workflows and Fleet Manager rules, so the floor improves itself instead of waiting for a report.
No piecing the story together across five screens. SyncOSTM shows your team the full picture and the next step.
The fault or blocker, and the robot and task involved.
The outcome in danger, such as a line close to running short.
The state of material, robots and stations just before the issue.
A recommended fix, based on what has worked before.
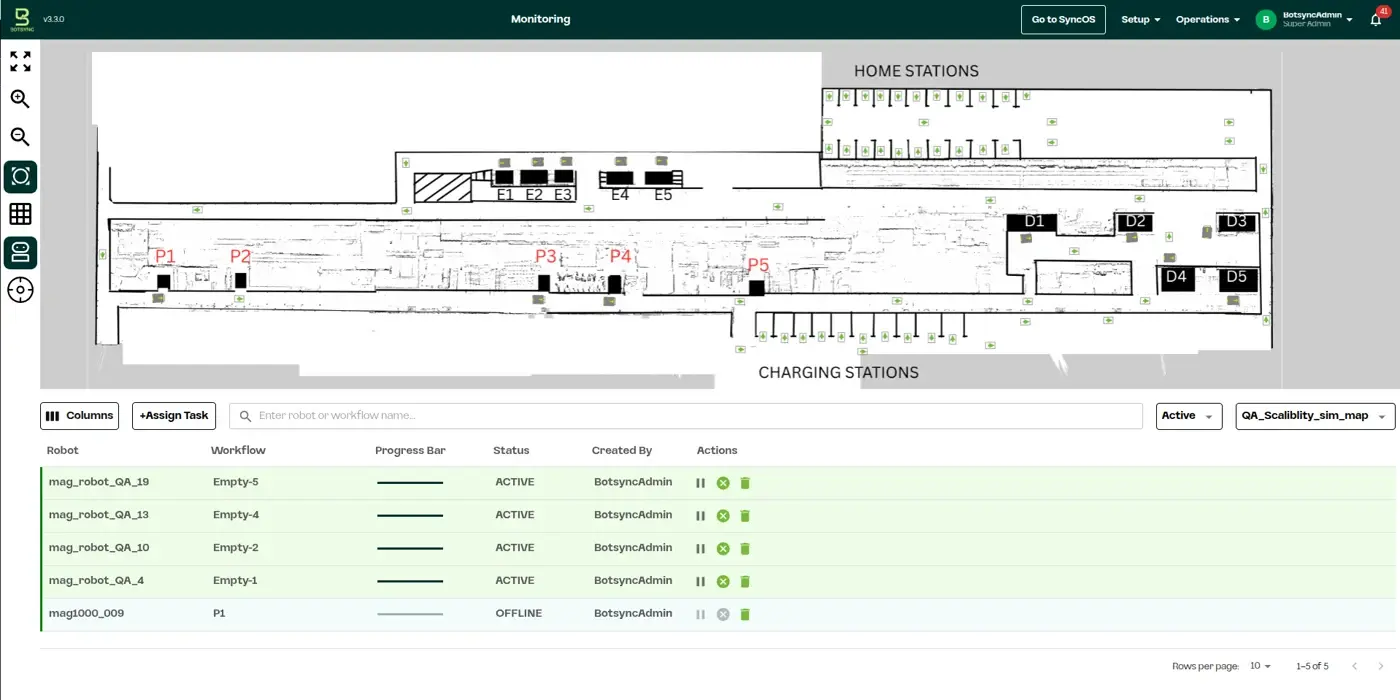
SyncOSTM Dashboards brings fleet, task, process and system information into one unified view, with real-time visibility into ongoing activity, system conditions and automation performance. See what's happening at a glance and spot what needs attention.
Unified operational view
Fleet, task, process and system information in a single interface.
Faster issue identification
Quickly find the activities, alerts and conditions that need attention.
Better operational awareness
Real-time visibility across every connected system.
Build views around the KPIs, processes, assets and information that matter most to each role. A shift supervisor, a maintenance lead and a plant manager each get a focused view of what they own.
Role-based views
Focused dashboards for different teams and users.
Flexible KPI monitoring
Track the metrics that matter to each operation.
Your information, your way
Choose which processes, assets and data appear in each view.
Charts, graphs, tables and more, so every KPI, trend and performance metric is shown in the format that makes it easiest to read, compare and act on.
Flexible data representation
Charts, graphs, tables and other formats.
Easier interpretation
The right format for each type of information.
Clearer performance analysis
Compare KPIs and trends over time and across sites.
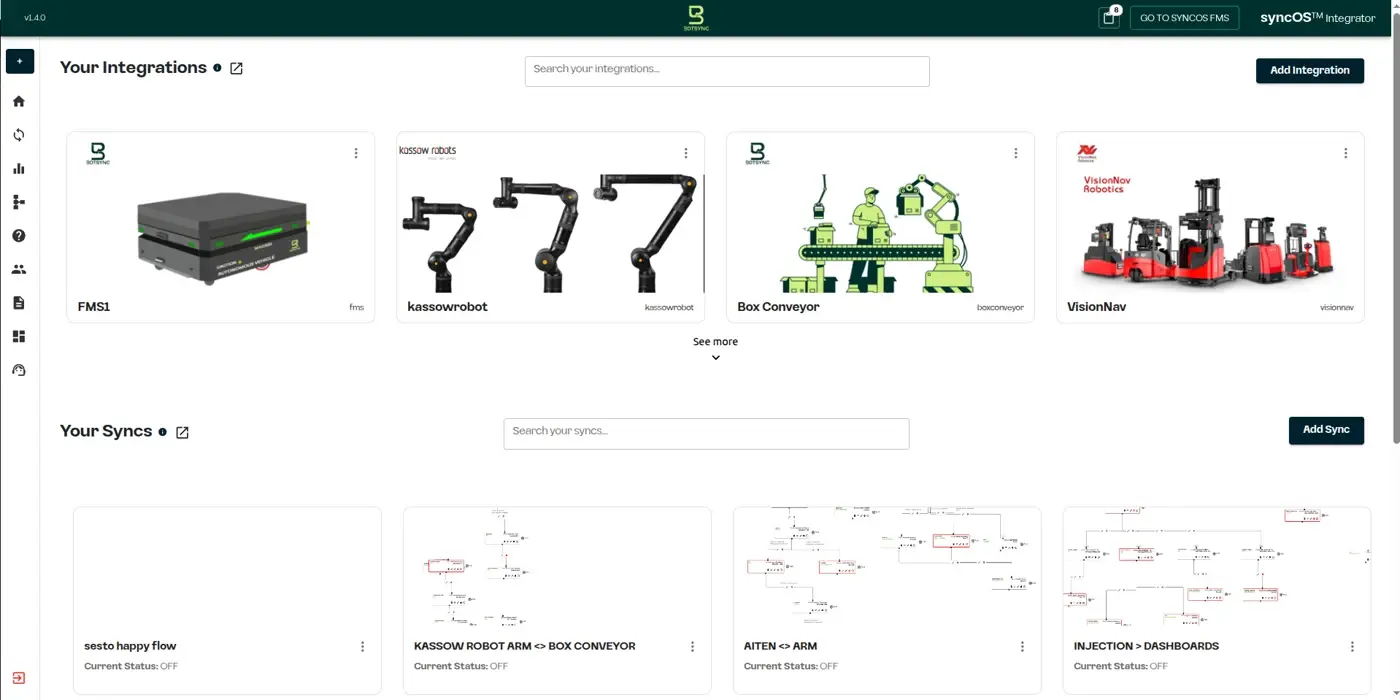
Integrator connects your floor. The rest of SyncOSTM runs your fleet and turns its data into decisions.